

Know who came to your site, where from and what they did, without opening GA4.
The Analytics view reads your Google Analytics 4 property and puts the four answers on one screen: how many people came, where they came from, what they read and what they did, for any range you pick. Every number carries its window and its source, and the header stamp says how old the page's data is.

Is my website traffic going up?
Open Analytics and the first tile answers it. It shows sessions for the window, the change against the period before, and the trend drawn under it. Click the tile and the chart switches to sessions; click Users or Pageviews and it switches to those, with no new pull. The two dates of the window are printed under the picker, and the comparison window beside them.
Pick the range you want to read. The picker offers the last 7, 30 or 90 days, the last 6 or 12 months, or a custom start and end, and compares any of them with the previous period, the same period last year, or runs without a comparison. The default is the last 30 days against the 30 before. Each window is a live request to your GA4 property. The chart is bucketed by day for spans up to about three months, by week up to about a year, and by month beyond that, so a two-year series reads as a trend instead of 730 daily points. Hover any point and the tooltip reads both series at that bucket.
Every preset ends yesterday. Today is partial in GA4, and a half day at the right edge of a chart reads as a collapse, so the picker leaves it out. A window you have already asked for is held for five minutes, so clicking between 30 days and 90 days and back costs one GA4 read, not three. Change the range and the old numbers stay on screen, dimmed under a spinner, so you can tell the figure being replaced from the one that is current. Export the view and the CSV holds what is on the screen for the range you picked, not a default window.
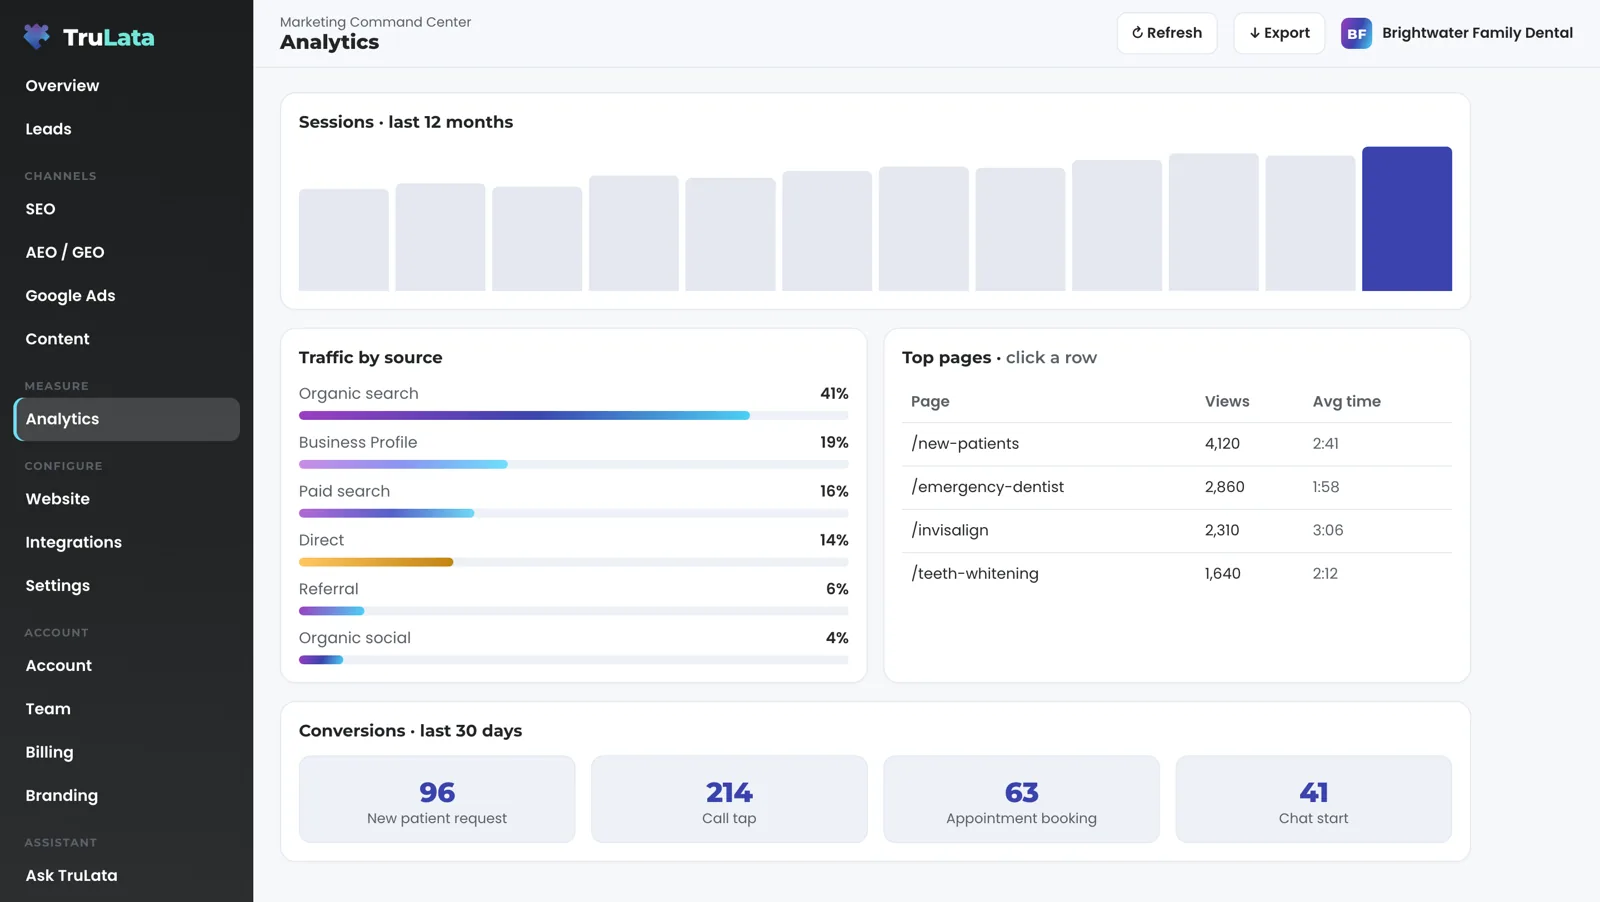
Where did they come from, and what did they read?
Traffic by channel splits sessions the way GA4 groups them: organic search, paid search, direct, referral and organic social, up to eight channels with a count each. Under it, source / medium lists up to twelve rows, so google / organic and google / cpc are separate lines and a referral from one site has its own row. A devices table splits the same sessions across mobile, desktop and tablet. With a comparison on, every row carries the prior figure and the change, coloured by direction.
Top pages ranks the pages people read by views. An engagement table under it carries bounce rate, average session length, engaged sessions and new users, this period beside the comparison. Read the two together. A service page that draws its views from organic search and holds a reader for three minutes is doing its job. A blog post that draws views from social and loses readers in twenty seconds is a post, not a lead source. This is the card that says which is which.
The demo shows the shape with illustrative numbers, and says so. Its Analytics view reads 1,740 sessions in the latest month, up 7 percent on the month before. Organic search carries 38 percent of traffic, AI referrals 16 percent and direct 15 percent. The top page holds readers for 3 minutes 12 seconds, and 84 demo requests were counted in the last 30 days. Your instance reads your property, and only the demo invents a figure.
A post, not a lead source
- Views from social
- Readers gone in twenty seconds
A page doing its job
- Views from organic search
- Readers held for three minutes
What did they do, and can I trust the count?
The conversions tile counts each key event over the window: form submissions, call taps, chat starts, quote requests, whatever your property is set to record. A table under the tiles lists each event under a plain label instead of its snake_case name, with its count, its prior and the change. In the demo the card is fixed to the last 30 days; click an event for its count and the note attached to it.
On a dashboard with a live Leads feed, lead actions lead the page. The conversions tile comes first, the chart opens on lead actions, and the first table is headed What they did. Traffic is the supporting cast, because traffic only matters when it turns into a request, and the layout says so.
A key event is what a tag counted. It is not a lead. Your lead sheet, written server-side by your form handler the moment a form is submitted, is the record, and the Leads view reads it newest first. On an instance whose forms feed that sheet, a watch runs every morning at 7:20 Eastern with five checks over the last seven days: the tracking tag still loads on the live pages, leads in the sheet against zero form events in GA4, paid leads against zero Ads conversions, a campaign that was spending gone to zero, and organic traffic with no leads at all. The second check is exactly that gap: the sheet fills while GA4 reports zero, so the site tag is dead. A finding reaches the team the morning the run makes it, so a dead tag, a blind ad account or a stalled form is named the next day rather than at the end of the quarter.
Where conversion tracking was rebuilt on a property, for example an older setup that counted page taps and map clicks as conversions, the figures from before that date are excluded rather than shown wrong. The tile reads not tracked in this era, a note on the page says when and why, and sessions and users stay comparable across the whole range. A zero that is really a tracking change reads as a tracking change, with the note beside it.
A tag's count against your forms' count
- Your lead sheet, written server-side
- GA4 key events
- Google Ads conversions
- The tag still loads
- Sheet against GA4
- Paid leads against Ads
- A spending campaign gone to zero
- Organic traffic, no leads
A key event is what a tag counted. It is not a lead.
Why is GA4 hours behind when my CRM is live?
Because Google publishes GA4 intraday data on its own schedule, hours after the fact, and no dashboard can read what Google has not released. The page states the ceiling per source instead of labelling everything live. Your CRM, Stripe, your booking platform, website leads and email stats are live, and a refresh moves them. Google Ads lags hours. GA4 intraday lags hours. Search Console releases each day two to three days later.
Here is what happens when you open the page. Last night's snapshot renders first, so there is something to read before any network call returns. The live payload comes from a cache at once. If that snapshot is older than five minutes, a pull runs behind the request and the numbers update when it lands. The header stamp says how old the data is, and its hover text says which case you are in: pulled live when you opened the page, or the last saved snapshot because the live refresh was unreachable. Press Refresh and a pull of two seconds to a little over three minutes starts; the page reloads when the stamp moves, and every path through it ends in a reloaded page.
Two things run on a schedule whether anyone is at a desk. At 12:01am Central, one job rebuilds the fallback snapshot for every client from one registry, and a pull that fails or a file that fails its syntax check leaves the previous page up, so the page you open is always a whole one. At 7:20am Eastern, the lead watch runs where it is set up. Two things stay with a person. Which events count as key events is set in your own GA4 admin. A change you request from the screen, to content, keywords, categories or targeting, goes to the team as a logged ticket, and the engine's writes to your ad accounts and your site go through each platform's API and land in its own change history.
Know the edge of the view as well. It reads your GA4 property; the rest of your dashboard reads the sources connected to your instance, with more connected during setup. Your customers' card data is never read. A phone call counts when your CRM records it. Google AI Overviews are measured on the search visibility view.
When you open the page
- Last night's snapshotOn screen before any network call returns
- Live payloadServed from a cache
- A pull behind the requestThe numbers update when it lands
- A new pull2 seconds to a little over 3 minutes, then a reload

No dashboard can read what Google has not released.
Is Search Console on this view too?
It has its own view, on purpose. Search Console sits on the search visibility view with queries, impressions, clicks and average position, and Google AI Overviews are measured there as well. Analytics is the on-site half: what happened after the click. Search visibility is the off-site half: what happened before it. Keeping them on separate views keeps two different Google systems from being read as one number.
Both are read from Google and both print their lag. GA4 runs hours behind. Search Console runs two to three days behind, so the search view carries a note under its tables: Search Console reports two to three days behind, and the most recent days in the range are still filling in, not dropping. The position you read there is the average position Search Console reports for the query, and the same picker, presets and comparison run on both views.
Two Google systems, two views
Analytics
- The on-site half: what happened after the click
- Read from GA4, hours behind
Search visibility
- The off-site half: what happened before it
- Read from Search Console, 2 to 3 days behind
How do I connect it, and what should I check in the demo?
Add our Google account as a manager on the property, from access management in your own GA4 admin. That is the whole connection: our team does the rest during setup, and we never ask for your account password. You grant the access during setup and revoke it in the same screen at any time.
On our side the property is saved once in your account's connection map, and every request the dashboard makes uses that saved property, so the property id stays on the server, and the dates the browser sends are checked before they reach Google. Revoke the access and the next window that has not been pulled answers with an unavailable card instead of a number; the rest of the dashboard is unaffected, and the nightly bake leaves the last good page up.
Check it in the demo before you buy. Open demo.trulata.com, go to Analytics and click the sessions card: the drill-down shows the latest month, the change on the month before, and names GA4 as the source. Click a traffic source for its share, a page for its views and average time, and a conversion tile for its 30-day count. The demo is a fictional company on the same engine code every client runs, with your name and email in front of it. The date picker is switched on per instance during setup, so the demo shows the twelve-month view.
- You grantManager access, from access management in your own GA4 admin
- We saveThe property id, once, on the server
- The browser sendsDates only, checked before they reach Google
- You revokeSame screen, any time; the next window reads unavailable
What the analytics view reads.
| What | Where it comes from | How fresh |
|---|---|---|
| Sessions, users, new users, pageviews, bounce rate, average session length, engaged sessions | GA4 Data API, your property | Hours behind intraday, set by Google |
| Traffic by channel, source / medium, device | GA4 Data API | Hours behind |
| Top pages by views | GA4 Data API | Hours behind |
| Key events, by name and count, with prior and change | GA4 Data API, the window you picked | Hours behind |
| Date ranges | 7, 30, 90 days, 6 or 12 months, custom, with a comparison | Held five minutes per window |
| Form leads, the record | Your lead sheet, on the Leads view | Live |
| Key events | Set in your own GA4 admin; the view reads what you set | Read on each pull |
A key event is what a tag counted and your lead sheet is what a form recorded, so on an instance whose forms feed the sheet the two are compared every morning at 7:20 Eastern.
Questions, answered.
Is GA4 data live in TruLata?
As fresh as Google releases it, which is hours behind inside GA4 as well. The view shows the newest point Google has released, every preset ends yesterday, and the header stamp says how old the data is.
Do I still need to log in to GA4?
Sessions, users, pageviews, sources, pages, devices, engagement and key events are on the view for any range you pick. GA4 stays yours for deeper exploration, and our manager access leaves your property exactly as you set it.
What counts as a conversion?
Whatever key events your GA4 property is set to record: form submissions, call taps, chat starts, quote requests. On a dashboard with a live Leads feed they are labelled lead actions and listed under plain names.
Why compare GA4 with my lead sheet?
Because a tag that stops firing makes GA4 report zero while leads keep landing. On an instance whose forms feed the sheet, the watch runs at 7:20am Eastern every day over a seven-day window and alerts when the sheet holds leads and GA4 recorded none.
Can I pick my own date range?
Yes. The last 7, 30 or 90 days, the last 6 or 12 months, or a custom start and end, compared with the previous period or the same period last year. Every preset ends yesterday, because today is partial in GA4.
Can the product change my GA4 settings?
It reads the property through manager access you grant, and your settings stay yours: key events are configured in your own GA4 admin, the view reads what you set, and you can revoke the access there at any time.
Where is Search Console?
On the search visibility view, with queries, impressions, clicks and average position, two to three days behind on Google's schedule.
Which tier includes the analytics view?
TruLata and full analytics are on all tiers. Prices and seats are on the pricing page.
See it running
before you decide.
The demo is the real product on a fictional company, with your name and email in front of it. Pricing is three published tiers.
Open the live demo See pricing
New here? See what TruLata is. Prefer to write? Send us the one thing you want to know.
Start here: AI marketing platform · AI marketing software · all-in-one marketing platform · marketing automation software · marketing software for small business.
- Refreshed when you open itLive data on page load, never a monthly PDF
- Counted from your own formsLeads recorded server-side, compared daily with Ads and GA4
- Seen in AI answersHow often ChatGPT, Gemini, Claude and Grok name you, measured
- Every send loggedProspect emails leave from a review-first queue, and every send is logged.