

See where your visitors come from and what they do, next to the leads that actually landed.
Add our Google account as a manager on your GA4 property. Sessions, sources, pages and key events then sit beside your leads and your revenue on one screen, and the header stamp says how old the data is.

What do I get from my GA4 property?
Six totals for any window: sessions, users, new users, pageviews, bounce rate and average session duration. Sessions break down by default channel group and by source and medium. Pages rank by views. Key events, GA4's name for conversions, arrive by name and count. A day-by-day series of sessions, users and pageviews draws the trend chart. Every number is a report request against the GA4 Data API on the property you connected.
Sessions by device and engaged sessions fill the devices and engagement tables. Together they answer the four questions you ask of analytics: how many people came, where from, what they read and what they did.
The four questions you ask of analytics
- Totals: sessions, users, pageviews, bounce, duration
- Channels, source and medium, pages
- Key events by name and count
- A daily trend
- How many people came
- Where they came from
- What they read
- What they did
Where do the numbers show up?
The numbers land in two places: the Overview and the Analytics view. The Overview carries the headline cards. On a dashboard that leads with traffic, two of them come from GA4: website sessions over the trailing thirty days with the daily trend, and tracked lead actions, the key events your site fires for a call tap, a form or a chat. Where your funnel starts at traffic, that same sessions figure is its top stage.
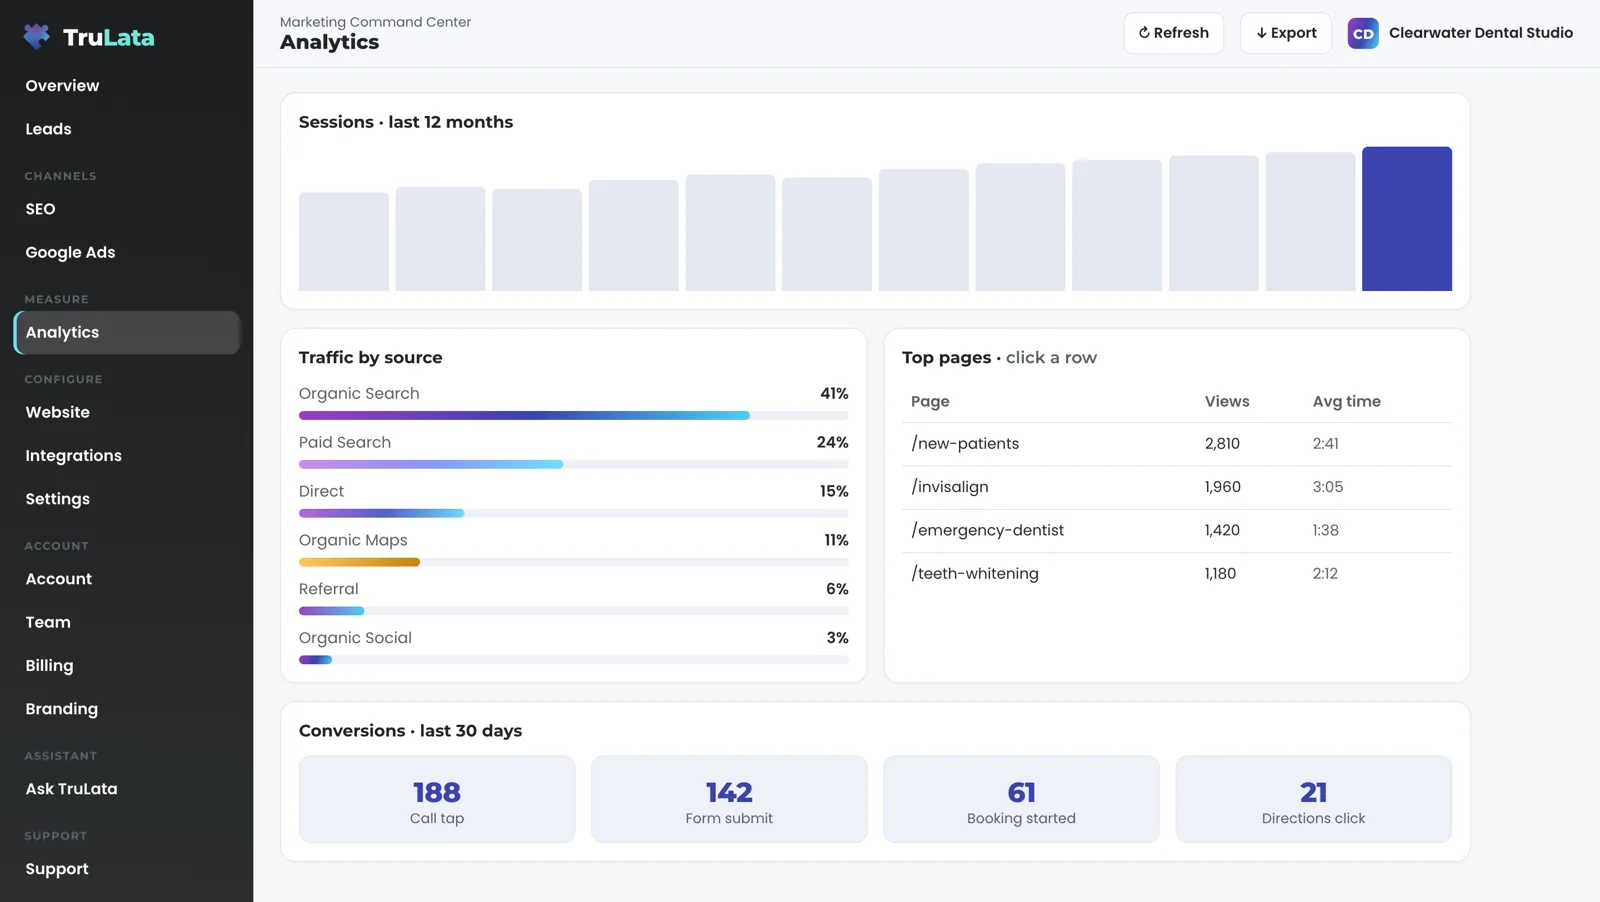
The Analytics view is the full read. You get a sessions card with trend and change, traffic by channel, top pages by views and the key events table. On a dashboard with a live Leads feed, that table leads the page as lead actions, each event given a plain label instead of its snake_case name.
Can I pick my own dates and compare periods?
Yes. Pick the last 7, 30 or 90 days, the last 6 or 12 months, or type a custom start and end, then add a comparison window. Each read is a live GA4 request for the window you chose, bucketed by day, week or month to suit the span. The comparison prints the change on the headline totals and the prior value beside each engagement measure. A window you have already asked for is held for five minutes.
Every preset ends yesterday. GA4 lags hours intraday, so the presets leave today out on purpose; a custom range takes the dates you type. If your site moved to a new GA4 property, the history stayed behind. We record which property holds which dates and read a range that spans the move from both properties, stitched. An era whose conversions are known to be wrong, say a property that counted page taps, has those conversions excluded, not footnoted.
The range picker
- PresetsLast 7, 30 or 90 days, last 6 or 12 months, or a custom start and end
- ComparisonThe change on the headline totals, the prior value beside each measure
- GrainDay, week or month, to suit the span
- End of rangeYesterday, on every preset
- HeldFive minutes per window you asked for
- A moved propertyBoth properties read and stitched across the move
Are GA4 conversions the same as my leads?
They are two different counts, and the product keeps them apart on purpose. A key event is what a tag on your site counted. A lead is what your form handler wrote server-side into the lead sheet the moment the form was submitted, and that keeps working when every tag on the page is dead. The Leads view reads the sheet; the Analytics view reads GA4. Where we have set the watch up on your forms, it runs every morning at 7:20 Eastern with five checks. One of them is exactly this: leads landed in the sheet while GA4 recorded zero form events, so the site tag is dead. The glossary entry on key events covers the vocabulary.
Here is why that check is worth running. A site change, a rebuild or a blocked loader can stop your Google tag firing, and from then on GA4 records no form events and Ads reports no conversions while your forms keep filling the sheet. Read the platform on its own and the campaign that carried the leads looks like the one to cut. The daily watch reads the two counts against each other, so a silent tag shows up the next morning rather than at the end of the quarter. The Leads view holds the ground truth; this use case shows why the two counts sit side by side.
A GA4 key event
- What a tag on your site counted
- Read on the Analytics view
- Stops when the tag stops firing
A lead
- What your form handler wrote server-side, the moment the form was submitted
- Read on the Leads view
- Keeps counting when every tag on the page is dead
Read the platform on its own and the campaign that carried the leads looks like the one to cut.
How do I connect it, and how do I take it back?
Add our Google account as a manager on the property, from access management in your own GA4 admin. That is the whole connection. You never hand over a password, our team does the linking from the inside, and you revoke the invitation in the same screen you granted it in. Access comes first.
On our side the property is saved once in your account's connection map. Every GA4 request the dashboard makes uses that saved property, so the property id stays on our side and out of the browser. Every click on the screen reads from GA4. The write paths from TruLata are a question to the team, a lead outcome, a website change request and a content or targeting request, each logged; a change to your GA4 setup, where your engagement asks for one, is made by our team with the access you granted and shows in your GA4 admin's change history. Revoke the access and the live read fails cleanly: the view shows an unavailable card and the nightly bake leaves the last good page up.
- Add our Google accountAs a manager on the property, from access management in your GA4 admin
- We save the property onceIn your connection map; the property id stays on our side, out of the browser
- Revoke in the same screenThe live read fails cleanly and the last good page stays up

See where your visitors come from and what they do, next to the leads that actually landed.
How fresh are the GA4 numbers?
Hours behind intraday, and that ceiling is Google's. Your CRM, Stripe, the lead sheet and email statistics are live on the same dashboard; Google Ads runs a few hours behind and Search Console two to three days. The page loads last night's snapshot first, so there is always a page to read, fetches the live payload from a cache at once, and runs a pull behind the request if the snapshot is older than five minutes. Press Refresh and a pull of two seconds to a little over three minutes starts; the page reloads when the stamp moves.
The header stamp says how old the data is. Every path through Refresh ends in a reloaded page with a fresh stamp. If a live read fails on a range you picked, the view shows an unavailable card rather than quietly swapping back to the baked numbers. The nightly bake at 12:01am Central is the fallback: a pull that fails or a file that fails its syntax check leaves the previous page up. What live means per source has its own page.

What the GA4 integration reads, and how fresh each read is.
| What | Where it comes from | How fresh |
|---|---|---|
| Sessions, users, new users, pageviews, bounce rate, average session duration | GA4 Data API, the connected property | Hours behind intraday, set by Google |
| Traffic by channel and by source / medium | GA4 Data API | Hours behind |
| Top pages, by views | GA4 Data API | Hours behind |
| Key events, by event name and count | GA4 Data API | Hours behind |
| Daily trend of sessions, users and pageviews | GA4 Data API | Hours behind |
| Sessions by device, engaged sessions | GA4 Data API | Hours behind |
| Lead comparison | Your lead sheet against GA4 form events | Daily at 7:20am Eastern, where the watch is set up |
| Changes to GA4 | Our team, with the access you granted, where your engagement asks for one | Logged in your GA4 admin's change history |
The tag's count and the sheet's record sit side by side, and where the watch is set up on your forms it compares them every morning at 7:20 Eastern, because the day they disagree is the day a budget gets cut on the wrong number.
Questions, answered.
Is GA4 data live in TruLata?
It is as fresh as Google releases it. Google publishes intraday data hours behind, inside GA4 too. The dashboard shows the newest point Google has released, and the header stamp says how old it is.
What does the product count as a conversion?
The key events your GA4 property is configured to record: form submissions, call taps, chat starts, quote requests. On a lead-generation dashboard they appear as lead actions with plain labels.
Do I have to give you a password?
You add our Google account as a manager on the property in your own GA4 admin, and you remove it in the same screen whenever you choose. We never ask for your account password.
Can TruLata change my GA4 settings?
Every click on the screen reads from GA4. The write paths from the dashboard are a question to the team, a lead outcome, a website change request and a content or targeting request, each logged. Where your engagement asks for a change to your GA4 setup, our team makes it with the access you granted, and it shows in your GA4 admin's change history.
My site moved to a new GA4 property. Do I lose the history?
The history comes with you. We record which property holds which dates and read a range that spans the move from both properties, stitched. Conversions from an era that counted the wrong thing are excluded, not footnoted.
Which tier includes the analytics view?
TruLata and full analytics are on all tiers, and search visibility, where Search Console sits, on all tiers. The figures are on the pricing page.
See it running
before you decide.
The demo is the real product on a fictional company, with your name and email in front of it. Pricing is three published tiers.
Open the live demo See pricing
New here? See what TruLata is. Prefer to write? Send us the one thing you want to know.
Start here: AI marketing platform · AI marketing software · all-in-one marketing platform · marketing automation software · marketing software for small business.
- Refreshed when you open itLive data on page load, never a monthly PDF
- Counted from your own formsLeads recorded server-side, compared daily with Ads and GA4
- Seen in AI answersHow often ChatGPT, Gemini, Claude and Grok name you, measured
- Every send loggedProspect emails leave from a review-first queue, and every send is logged.